What Are Fundamentals?
Fundamentals are a way of judging whether a stock is cheap or expensive, and whether a company is financially stable, based on its earnings and financial statements. Where technical analysis reads price charts for timing, fundamental analysis looks at the substance of the company itself.
It sounds intimidating, but really you only need to know a handful of core metrics. Once you grasp what they mean and roughly what a 'normal' value looks like, you'll have far more to go on when picking stocks.
The Key Metrics, Explained
PER (Price-to-Earnings Ratio)
How many times a company's annual profit the current share price represents. Lower generally means cheaper; for Japanese stocks, around 15x is often cited as a rough benchmark, though it varies a lot by industry.
PBR (Price-to-Book Ratio)
Compares the share price to the net assets that would theoretically be returned to shareholders if the company were liquidated today. Below 1x means the stock trades below its 'liquidation value' — a common signal of being undervalued.
ROE (Return on Equity)
How efficiently a company turns shareholders' capital into profit. Higher is generally better, with 8–10% or above often cited as a healthy benchmark.
Equity Ratio
The share of a company's total assets funded by equity rather than debt. A higher ratio suggests less reliance on borrowing and a more stable balance sheet; 40% or above is often seen as relatively solid.
Dividend Yield
The annual dividend as a percentage of the share price. A higher yield looks attractive for income-focused investors, but a very high yield can also signal risk of a future dividend cut if earnings deteriorate.
Market Cap
Share price multiplied by shares outstanding — the market's total valuation of the company. Larger market caps tend to move more calmly; smaller ones tend to swing more.
| PER | ~15x is a rough benchmark (varies by industry) |
|---|---|
| PBR | 1x is the cheap/expensive threshold |
| ROE | 8–10%+ signals good efficiency |
| Equity Ratio | 40%+ is relatively stable |
| Dividend Yield | Higher is attractive, but watch for cut risk |
| Market Cap | Larger caps tend to move more calmly |
Why 'Learning by Using' Beats Memorizing
Definitions alone rarely make these numbers click. It's only when you compare PER or PBR across several companies and ask 'is this one cheap relative to its peers?' that the numbers start to mean something.
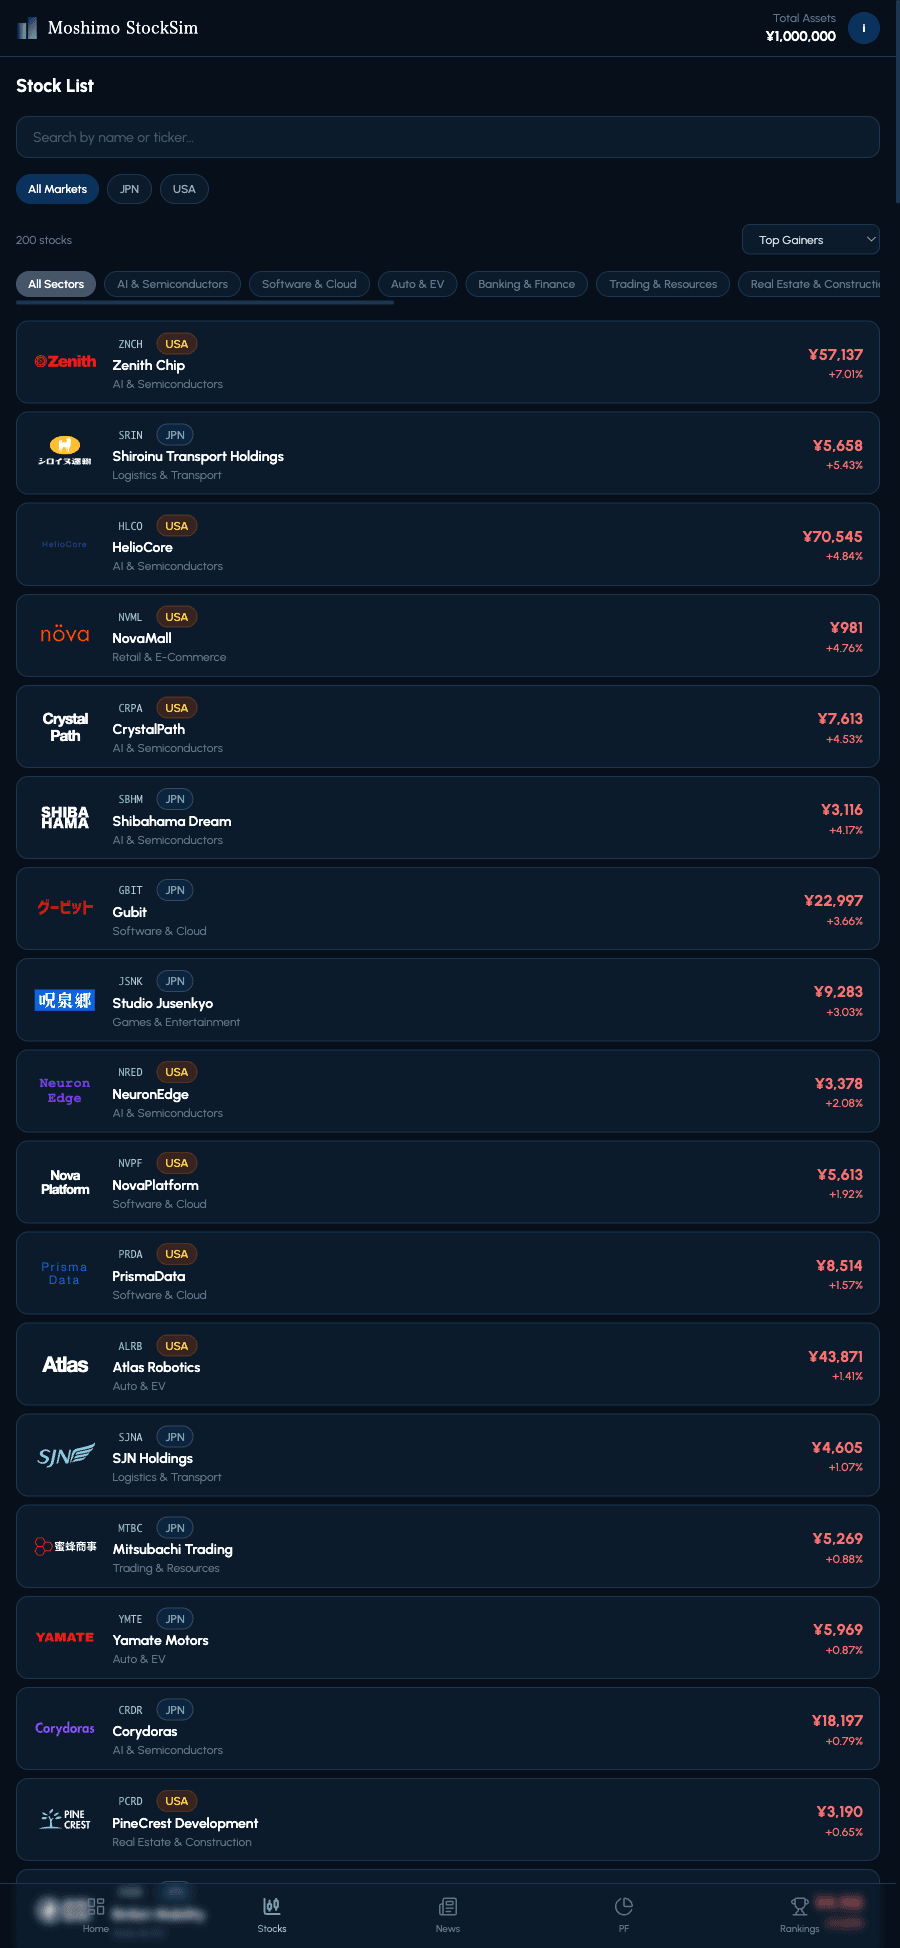
Fundamentals are rarely judged from a single metric in isolation — you weigh several together. That's exactly why comparing real numbers side by side is the fastest path to real understanding.
What You Can Check on Moshimo StockSim's Stock Detail Screen
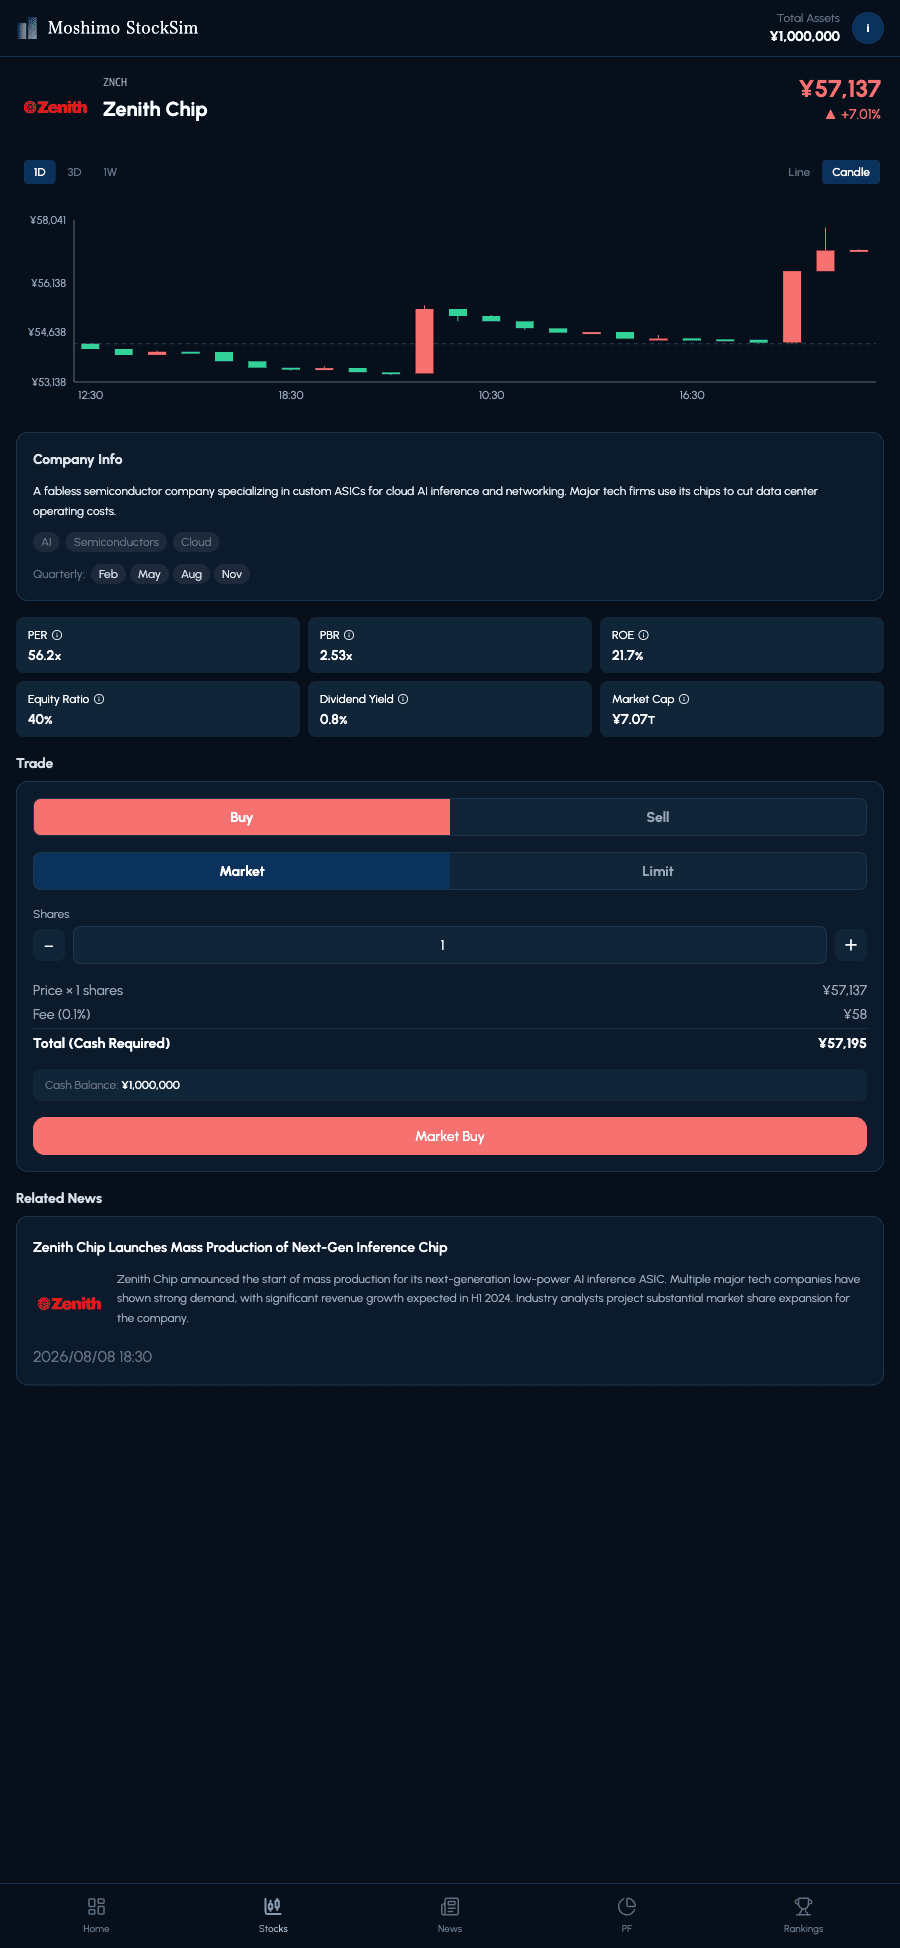
Moshimo StockSim's stock detail screen shows PER, PBR, ROE, equity ratio, dividend yield, and market cap for every fictional company, scaled to realistic price levels.
Once a stock catches your eye, glance at these metrics and compare it against others. Since there's no real money involved, you can freely browse dozens of companies and build a real feel for what 'cheap' and 'expensive' actually look like.
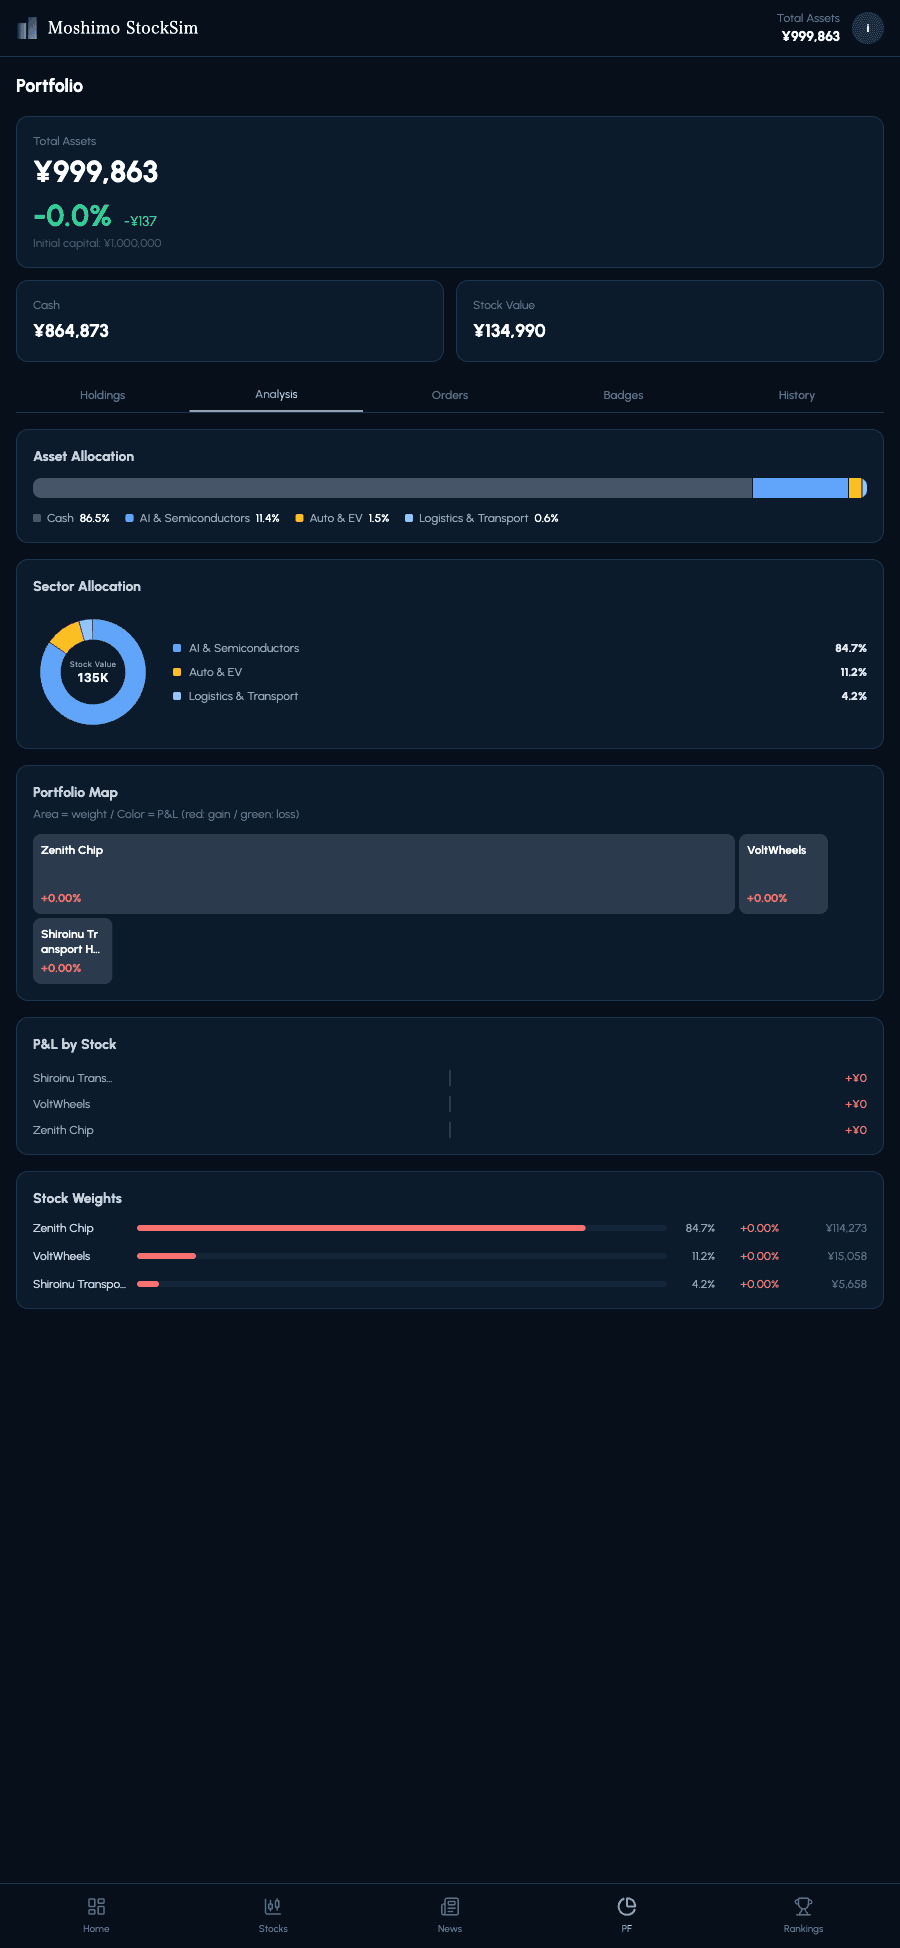
Real Stock Mode, which trades real U.S. companies like Apple and NVIDIA, also shows market cap for each one. A good combo: practice reading PER, PBR, and the other metrics on the fictional companies, then use Real Stock Mode to get a feel for actual company scale.
 Try Free US Stock Demo Trading
A closer look at Real Stock Mode, where you can practice free demo trading on 58 real US companies like Apple and NVIDIA.
Live prices from the shared market right now. Tap any stock to see its chart and news — no account needed.
Play free in your browserFAQ
Which matters more, PER or PBR?
Neither alone is enough — combining several metrics for an overall judgment is the recommended approach.
How long does it take to learn to read these metrics?
It varies, but comparing real numbers across companies typically builds a working intuition within a few weeks for most people.